Highs, lows & isobars
Isobars join places of equal pressure. Two centres (Northern Hemisphere):
| Low (cyclone) | High (anticyclone) | |
|---|---|---|
| Air motion | converges and rises | subsides and diverges |
| Weather | cloud, precipitation, poorer | fair, settled |
Surface Weather Chart:
- Observed 0000Z, 0600Z, 1200Z, 1800Z. Issued 2 or 3 hr later.
- Analyzes: mean sea level pressure, surface fronts, precipitation, obstructions to vision.
- Represents atmosphere up to 3 000 ft. Above, use upper level chart.
- Snapshot: check chart time, read with latest reports and forecasts.
Shapes:
- Ridge = elongated high.
- Trough (TROF) = elongated low.
- Col = neutral saddle between two highs and two lows.
Isobar spacing sets wind strength:
| Spacing | Wind |
|---|---|
| Close together | Strong |
| Far apart | Light |
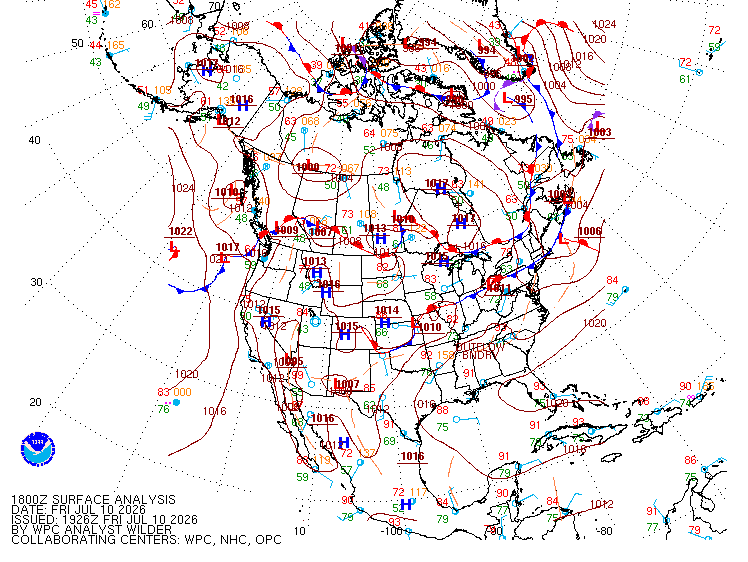
Station-plot wind barb:
- Shaft points to direction wind blows from (station circle is the arrowhead).
- Speed coded on shaft by barbs and pennants (values in
upper-level-prog-charts).
Buys Ballot's law: back to the wind, low pressure on your left.
Pressure trend at a station (rule of thumb):
| Trend | Signals |
|---|---|
| Rising | Fair weather approaching |
| Decreasing or rapidly falling | Bad weather, possibly severe storms |
Flight planning (rule of thumb, Northern Hemisphere), favourable winds:
| Leg | High | Low |
|---|---|---|
| West to east | North side | South side |
| Return | South side | North side |
Prognostic (forecast) charts project fronts and isobars forward in time:
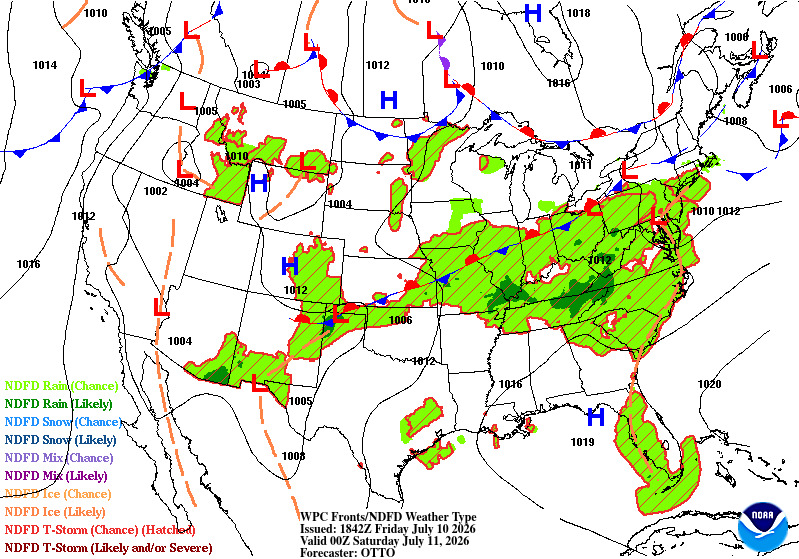
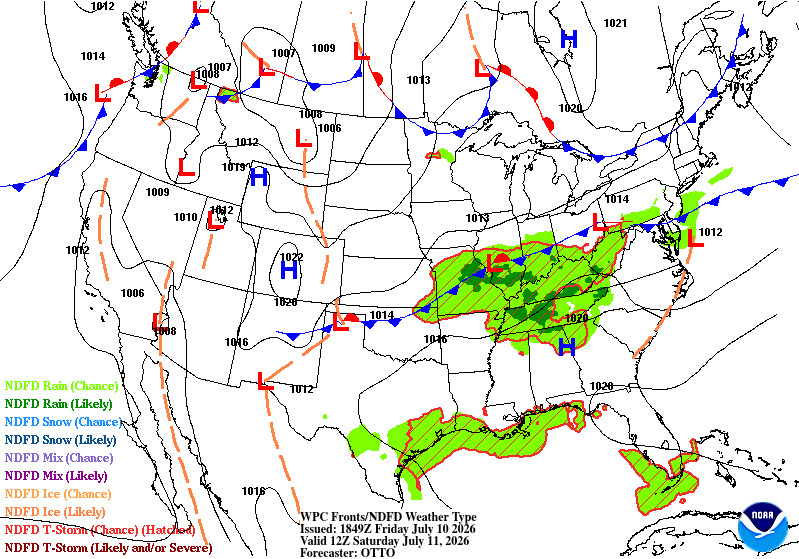
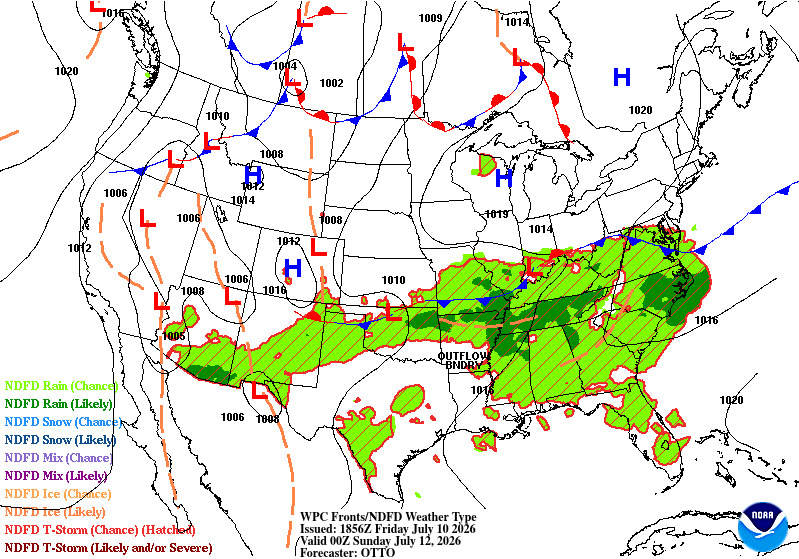
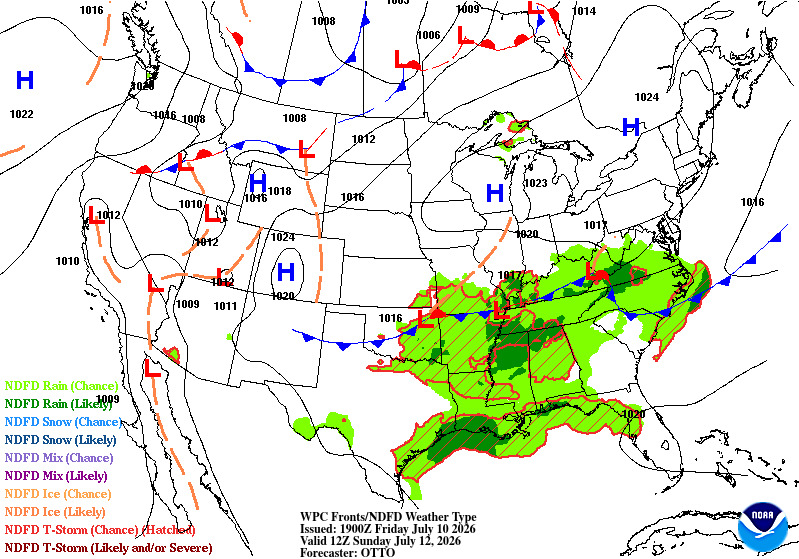
NOAA/WPC surface prognostic charts, public domain. The frontal and isobar reading skill transfers to Canadian charts; the Canadian GFA is a separate, differently formatted product (see its lesson).
Trap: reading a surface chart above 3 000 ft; use an upper level chart there.
References
- TC AIM MET 3.3 Table 3.3
- TC AIM MET 10.0
- TC AIM MET 11.1
- TC AIM MET 11.1(c)
- FAA Aviation Weather Handbook (FAA-H-8083-28)
- PHAK ch.12 (FAA-H-8083-25)